Methodology
WHAT IT IS
The Justice Snapshot is designed to accommodate a fast paced, risk-laden environment in which the criminal justice system has been severely eroded by conflict or disaster. Within a narrow time-frame (3 months), it engages with development partners and national authorities to produce a common evidence base for planning and costing early recovery in the justice system, while providing a monitoring and evaluation framework to measure progress.
Experience in Afghanistan, South Sudan and Somalia has shown that criminal justice data may be scattered, but they exist. The Justice Snapshot combines data collection, surveys and practitioner interviews within an accessible and easy-to-update website that anchors system stabilization in reliable baseline data and encourages national institutions to invest in data collection to inform and streamline priorities for early recovery.
The data are collected for a 12 month period against an agreed cut-off date. In this series of Justice Snapshots of South West State, Jubaland State and Banadir region (Mogadishu) the data are for the year up to 31 December 2019, save for the prison populations, which were registered on the date of visit, which were all in early 2020.
WHAT IT DOES
The Justice Snapshot sets in relief the wider security environment within which criminal justice operates. It depicts zones of control which could limit access to justice for ordinary people – threats to justice actors, which constrain their ability to serve – as well as the internal displacement of people due to conflict or environmental hazard, which could place unmanageable case volume pressures on the system. It provides a roadmap to proactively addressing extra-legal conditions that could limit and otherwise frustrate efforts to rebuild a national justice system.
The Snapshot sets out the political economy of multi-systemic arbiters of criminal justice and where people turn within that economy for justice. It depicts the roles that traditional arbitration, state justice services, or military protocol play and when and how often people resort to one over another.
Most importantly, it leaves national authorities and development partners with greater analytical and monitoring capacity than when it began. By embedding the vast array of information that has been collected, analyzed, and visualized within a website, which automatically regenerates new visualizations as new data are updated, the Snapshot establishes an increasingly accurate repository of data to inform both justice policy and the strategic interventions needed going forward.
WHY IT WORKS
It provides context, bringing together information about geographic zones of control and security, violence against justice actors, and the movements of people, as well as choices women and men make about where to turn for justice. This informs responses to better bring justice to both women and men, especially where armed groups or other authorities such as the military offer competing approaches to justice, including the provision of social services.
Data measure impact, compiling data from the most elemental level of individual police stations, courthouses, and prisons to identify weaknesses or gaps in personnel, infrastructure, and material resources. This enables state planners and development partners to assess and address highly strategic building, equipping, and training needs and to monitor and evaluate incremental progress over time so as to scale up what works and remedy what does not.
It is accessible, quick and transparent, applying a tried and tested methodology and using live, interactive, updatable visualizations to accentuate nuances in data, instead of a static report; while signaling discrepancies through data notes and making all source data available to users.
It is collaborative and transferable, engaging the justice institutions from the beginning in collecting and analyzing their own data to stabilize justice system operations and enabling national authorities to take over administration and update of the Snapshot following initial implementation.It is objective and apolitical, generating a series of data-driven, accounts of the functioning of the justice system, ranging across security and migration to infrastructure/resources, case-flow and governance – and weaving them together to illustrate how the whole of a country’s criminal justice system is functioning, giving national authorities the tools to inform their interventions, rather than policy prescriptions.
HOW IT WORKS
The data are collected from each justice institution (police, prosecution, legal aid providers, judiciary, prison – and their line Ministries) with the consent of the principals of each institution and line Ministry. The data are owned by the respective institutions and are shared for purposes of combining them on one, shared, site.
The methodology applied in the Justice Snapshot derives from the Justice Audit. The Justice Audit is distinguished from the Justice Snapshot in that the former is designed to build upon a stable, peaceable national environment and serve as a health check of the criminal justice system. It engages with governments to embark jointly on a rigorous data collection, analysis and visualization process to better inform justice policy and reform.
As with the Justice Audit, the Justice Snapshot does not rank countries, nor score institutions. Instead, it enjoins justice institutions to present an empirical account of system resources, processes and practices that allow the data to speak directly to the stakeholder. The GJG and Justice Mapping have conducted Justice Audits at the invitations of the Malaysian and Bangladesh governments (see: https://www.governancejustice.org/justice-audit)
The data collected in the Justice Snapshot comprise a breakdown of each institution’s resources, infrastructure and governance structures – and track how cases and people make their way through the system. All data are, in so far as it is possible, disaggregated by age, gender and physical disability. And all data are anonymised and Personally Identifiable Information (PII) removed.
These administrative data are triangulated with surveys of justice practitioners (police and prison officers as well as judges and lawyers) and court users (people coming to the courts for redress whether as defendants, victims, witnesses, or family members).
The baseline data sets are collected by independent research teams and enumerators under the guidance and with the support of the Justice Snapshot Steering Committee (JSSC) – members of which are nominated by their principals in each justice institution. Once the data are collected, they are cleaned of obvious error. Any gaps in data are indicated ‘No Data’ unless the data show, for instance, 0 vehicles. Where the accuracy of data cannot be verified, or require further explanation, these are indicated in the ‘Data Note’ box. The clean data are then submitted to the JSSC for validation and signed off by the institutions concerned. The cleaned data sheets appear by institution in the Baseline Data as these are the data visualised throughout the Justice Snapshots.
The GJG ran a ‘Data Integrity Check’ in Baidoa (July 2019) to understand how data are generated at source, by each institution; what data fields are collected; how the data are stored (paper or computer); how and to whom they are communicated; and how often and in what format. The Data Check in Baidoa revealed that most institutions have a register / ledger, or book to note people and cases coming into their institution (and leaving it), that the case numbers are low and that administrative training and equipment are poor.
Note: the data captured will never be 100% accurate. Gaps and error will occur especially in this first series of Justice Snapshots as those working on the frontline of the criminal justice system are not used to collecting data systematically and especially not on a disaggregated basis. However data collection and accuracy will improve over time and as systems are embedded within each institution.
The data are then organized and forwarded to Justice Mapping to upload on to the Justice Snapshot web application which is programmed and coded to visualize the data as they are updated. Both the Justice Audit and Justice Snapshot are designed to be living tools rather than one-off reports. The purpose is to capture data over time and identify trends and so monitor more closely what works (and so scale up) and what does not (and so recalibrate or jettison).
The data identify investment options to sharpen budgetary allocations (and improve aid performance for ‘Better Aid’) and enhance early recovery of justice services. These investment options are agreed in the final JSSC meeting with state level justice actors.
HOW DATA ARE UPDATED AND SUSTAINED
The engagement with key institutional actors at the outset is not just a courtesy. The methodology aims to maximize the participation of all actors and encourage them to invest in their own data collection better to inform policy for the sector as a whole and leverage more resources for their own institution. From the moment it is formed, the JSSC takes ownership of the process, and so is central to this approach.
Following this first series of Justice Snapshots, it is intended that each JSSC (and line ministries) will encourage their respective institutions to collect disaggregated data, at regular intervals, using standard data sheets. These data will be reported in line with existing procedures up the chain – and to an information management unit (IMU), or units, to conduct successive Justice Snapshots going forward at 1-2 year intervals to monitor change over time. The role of the GJG will be to provide backstopping and technical support as required.
THE JUSTICE SNAPSHOT TEAM
The Justice Snapshot team is headed up by Justice (retired) Johann Kriegler (founding Justice of the Constitutional Court of South Africa) and is managed by Radha Nair.
Allison Elders conducted the research and literature review for the Library from her base in the Bluhm Legal Clinic at Northwestern University School of Law, Chicago, USA supported by special adviser to the team, Tom Geraghty.
The research teams comprise:
- Transparency Solutions, directed by Latif Ismail in South West State, and Jubaland;
- Somali Peace Line, directed by Abdullahi Shirwa in Banadir region (Mogadishu).
These organisations are supported by practitioners in the GJG: Radha Nair, Kathryn English, Adam Stapleton, Marcus Baltzer, David Morgan and a team of data analysts: Fergal Stapleton English, John Roy Ballossini Dommett and Finneas Stapleton English.
The information technology and data design team is directed by Eric Cadora, founder and director, Justice Mapping (USA). He is supported by:
- Charles Swartz, IT Manager
- Andrii Ielbaiev, Computer Programming Engineer,
- Alexandra Dubow and Tatiana Temple, Data Visualization Designers, and
- David Bumbeishvili, d3 Code Programming Leader.
All translations into Somali from English were undertaken by Abdoulkarim Hassan (qurusdoon@yahoo.com).
Each Justice Snapshot followed a six-stage process:
- Planning
- Framing
- Collecting
- Interrogating
- Designing
- Validating
1. Planning
In the first phase of this process, the GJG with Justice Mapping developed a ‘beta version’ Justice Snapshot between March-August 2019.
Since this approach constituted a ‘first’ in Somalia, the consensus view was that showing people what this new tool was about was a good idea. The beta version was completed following a broad consultation with State and Federal governments as well as donor agencies and implementing partners.
While it was intended to follow on in September 2019 with the second phase (populating the beta version with actual data), this only got under way at the end of January 2020 when a contract was signed with UNOPS to 31 July.
Given the start of Ramadan on 23 April this reduced the time available for planning (some of which was undertaken in the interim since September 2019):
- Review of institutional baseline data sets for SWS, Jubaland and Banadir region (Mogadishu);
- Design, draft and carry out cognitive and field tests of Court User and Practitioner Surveys;
- Translation of all data sets and surveys;
- Procurement of tablets and programming with Software;
- Initial workplan to end February agreed with GJG partners: TS and SPL.
- TS data collection teams for South West State and Jubaland to be trained and deployed by end February.
Given the politics of Mogadishu and Hargeisa, more focus was placed on starting the data collection in SWS and Kismayo.
A review was conducted of available software. The team decided on Fulcrum Surveyor as it provided the necessary technological functionality. A review was also conducted of available tablets and Lenovo was selected after comparison of prices and functions.
Designing the data collection tool
An application was created for each institution and populated with fields informed by the baseline data. In line with these data, each application contained the seven dimensions across which data would be collected within each institution. These include: material resources, human resources, physical infrastructure, security and violence, case management, training and governance.
Response fields: Each application comprised of these seven sections, within which fields were created to cater to each question. Fulcrum offers multiple options with regards to the selection of the type of question, and so field to use, these include:
- Yes or No responses
- Numeric responses
- Multiple Choice
- Singular Choice
- Text field responses
Information section: Once the field was selected, each question was lettered and numbered, and supplementary information was included in the information section of each question. This segment was essential for a researcher seeking elaboration on the meaning of the question, and in guiding them towards the desired source of information.
Required: Another function offered by Fulcrum within each field is to make that question required. This prevents a record from being submitted until all required fields are complete. This was an important mechanism in ensuring that fields could not be accidentally skipped.
Practitioner Survey: A single application was created for the practitioner survey. This application comprised three sections, the first two mainly populated with drop down multiple/singular choice options. The third, aiming at capturing the three main challenges of each respondent, consisted of three text fields. While for the institutional surveys the GPS was a necessary function, to safeguard against revealing personally identifiable information (PII) this was disabled in gathering practitioner survey data.
Researchers gathering institutional data inside, for instance, a police station, prison or court, would then seek the informed consent of individual practitioners to conduct the survey. In Mogadishu, 88 Practitioner Surveys were conducted and 87 in both Jubaland and SWS combined.
‘Other’ options: wherever there exists multiple, or singular choice question fields an ‘Other’ option was always provided. Selection of the ‘other’ field would trigger a pop-up which allowed for the insertion of text.
Court User Surveys: Four separate applications were created for each of the categories of court users (victim, accused, witness & family member). Researchers attended court on different days and focused on those using the first instance courts (namely, District and Regional Courts). In Banadir region, the courts were closed by government order in Mogadishu due to the pandemic. In Jubaland and SWS, the researchers conducted 125 Court User Surveys, of which 80 respondents were men and 45 were women (Accused: 31, Family member: 33, Victim/Complainant: 33, Witness: 29). Most cases were civil in nature. The surveys were conducted over a period of two to three weeks.
Translation: A corresponding translation table was created per application, which followed the lettering and numbering of each section and their respective fields. Each question was then inserted into a translation table (see below) comprising four columns (english label, somali label, English description & somali description). Once these tables were complete, they were cross-checked to make sure they were in-sync with the designed application. The translation of each question, and its description, source or drop-down options, were inserted in a separate column of the same row. Once received these were manually uploaded into the corresponding question in each application, so that each question was first in Somali and then repeated in English.
| English Label | Summadda Af Soomali | English Description | Faahfaahin Af Somaali |
| Date? | Taariikh? | – | – |
| Time? | Waqti? | – | – |
| Region? | Gobol? | – | – |
| District? | Degmada? | – | – |
| Town? | Magaalada? | ||
| A. Material Resources | A. Agabka | ||
| 1. Electricity supply? | 1. Adeegga Korontada/laydhka? | Interview. If partial ask how many hours per day. – None – Partial – Continuous – N/A | Waraysi Haddii qayb ahaan uu jiro weydii imisa saacadood maallintii. – Maba jiro – Qayb ahaan – Si joogto ah – N/A |
Manuals: Data Collection manual and Court user manual were developed to supplement the five day training course and act as guide to researchers in the field. Each manual was translated into Somali.
2. Framing
Training: a five-day training course was developed introducing the tablet and the fulcrum application. Much of this was technical:
- Alternating between views on the dashboard
- Selecting desired application
- Beginning new record
- Updating status of record
- Geo-tagging
- Using the (i) information button (elaboration on question & necessary source of data)
- Cases of no data, unverifiable data, or unreliable data (-99)
- Role and purpose of data notes (to provide additional or supplementary information)
- Saving as draft
- Changing application
- Returning to draft
- Completing, saving and synchronising
The training maximised participation and learning by doing. Researchers started at the outset with new tablets and learned how to navigate them. They then went through each institutional questionnaire and the seven dimensions across each. Researchers sourced data from interviews, registers/ledgers and observation. So when the person interviewed indicated a number of computers, the researcher asked for these to be pointed out and counted them; or when a person was asked for a percentage (say, of lawyers representing accused at trial), the answer was the person’s opinion (unverified); or when case figures were supplied, the researcher cross checked these figures in the relevant register, ledger, Occurrence Book as appropriate.
They were also trained in survey data collection applying the Court Users and Practitioners Surveys. Strong emphasis was placed on ethical considerations when conducting surveys and the importance of obtaining free and informed consent before conducting any survey.
At the close of the training, the researchers planned their work in each location and GJG explained how the data cleaning was to proceed.
The teams or their representatives from TS and SPL then met formally with the Justice Snapshot Steering Committee (JSSC) members to a) introduce the team members, b) agree the workplan and c) ensure all institutions to be visited were notified by the JSSC member responsible in advance.
The TS team (Jubaland and SWS) was trained in the DFS compound in Mogadishu between 16-20 February 2020.
The SPL team (Banadir region) was trained in the DFS compound in Mogadishu between 16-19 March 2020. A day was lost due to security guarantees for each participant required by NISA.
The JSSC meetings to launch the data collection were held as follows:
- SWS (Baidoa): 23 February
- Jubaland (Kismayo): 24 February
- Mogadishu: 22 March
3. Collecting
After the teams were presented to the JSSC and the workplan formally agreed, JSSC members notified ‘their people’ about the research: who would be coming to which institution, when and to request their cooperation and support.
This first JSSC meeting was important in conferring ownership of the data collection process to the institutions themselves as well as providing legitimacy to the teams engaged in data collection.
GJG Data Analysts (DAs) provided close support to the teams in the field. As data were collected and shared (in real time) with the DAs, they were able to check for obvious error, outlier and question why certain data fields recorded ‘-99’ (ie ‘no data’). Daily call-ins with the teams dealt with any questions or problems with sourcing data – and planned for the next day. It was agreed that any problems should be referred to the team’s supervisor who could then follow up with the JSSC. There were no such problems in any of the locations and there was no need to call on this support.
The Fulcrum data were exported as Excel files into a Dropbox account. The GJG DAs then checked the data for accuracy as well as internal consistency and completeness.
During the cleaning process, any changes to the raw data were saved to a new data cleaning file (the raw data file was left unchanged) and a note logging the change was inserted in a log file.
By the time the data was ready for validation by the JSSC, it had been scrutinised by at least 4 sets of eyes (2 DAs, GJG team leader & research supervisor).
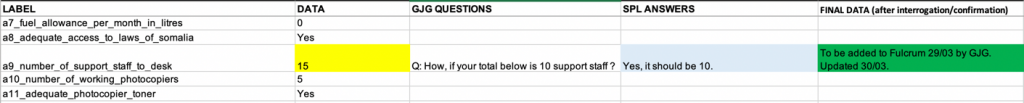
Colour-Coding
Colour coding was used to track status changes made during cleaning.
- Yellow – Issue to Resolve / Question / Flagged Problem
- Orange – Translation Needed / Confirmation of Translation Needed
- Blue – Value to be updated in Fulcrum
- Green – Value is confirmed to be Updated in Fulcrum
Responding to Feedback sent from GJG
GJG DAs framed a series of questions to the researchers through their supervisors. The answers or explanation to the questions were then entered in the cell to the right of the question and sent back.
Keeping track of changes
Whenever a change was made to an excel document, the date of this change was logged.

Inserting ‘Data Notes’
Where data lacked clarity / revealed discrepancies, or required more information or indication of source where this differed from interview, observation or institutional record, a Data Note has been inserted.
Adding Pictures submitted Separately (i.e. by Whatsapp)
Where researchers sent pictures separately or outside of Fulcrum, they were added to the record with appropriate captions within the record.
Creating JSSC Ready Documents for Validation
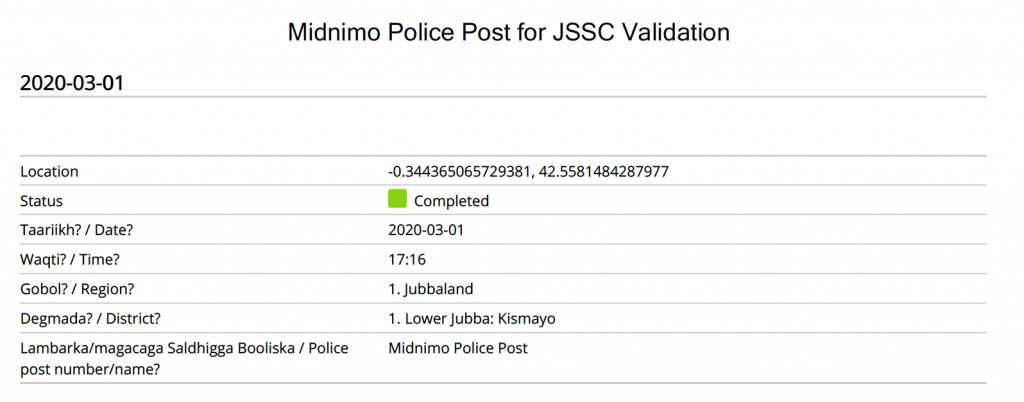
After all changes were made to the record in Fulcrum (sourced and dated updates received from the researchers or coordinators), the team generated a PDF report of the data.
PII: all records in Fulcrum were cleaned of personally identifying information (PII).
Analytical Steps
Institutional data
Codes were added to the data in the Excel files to enable front-end software developers to know where in the Excel-file-generated-database to go to get information for any particular piece of data on the website.
Practitioner and Court User Survey data:
As the data were not susceptible to any cleaning, they were organised and the data sorted by answer. Questions over translation were checked with several different sources.
Practitioner Survey: A number of respondents answered at variance to the question, for example ‘security’, to a question geared to the physical conditions of the workplace. While some of the responses that pertain to the question have been incorporated in the ‘other’ category, some demonstrate a lack of understanding as to the purpose of the question, as in the above-mentioned example. This suggests mistranslation or misunderstanding on the part of the researcher, and so to prevent detracting from the real aim of the question, these divergences have been incorporated into ‘other’.
The court user data comprises 125 (men: 80, women: 45) respondents aggregated across the four (primary) data-collection sites in South-Central, since there was little, to no diversity between the responses received irrespective of location.
The data are not presented to be representative, but offer an insight into choices as to justice pathways, gauge the confidence in the system of those women and men interviewed, and may help to inform subsequent research. It was not possible to establish a reliable range of the costs of accessing justice in criminal cases. Many respondents were reticent and ‘preferred not to answer’, while others said they paid nothing. Those who reported making a payment had made it to: elders, doctors, the courts. Those who paid police, prison guards or judges appeared to be outliers. Barely 20% cases for which the court users interviewed were attending court appeared to be criminal in nature.
There were no significant differences between court user responses in Jubaland and SWS and so the results were aggregated. Court users were divided into four categories: Defendants/Accused (31), Complainants/Victims (32), Witnesses (29) and Family members (33). A total of 125 (80 men and 45 women) people were interviewed outside court.
Over the data collection period, researchers visited the courts of first instance between at Afgooye on 4 occasions, Xudur on 7 occasions, Kismayo on 5 occasions and Baidoa on 8 occasions. Monthly case-loads (civil and criminal combined) vary: in
Xudur (pop. 108,902) an average of five cases are heard, researchers interviewed 40 court users (11 victims, 10 witnesses, 9 family members and 10 accused).
Baidoa (pop. 315,679) an average of 8 cases are heard. 32 people were interviewed 8 victims, 6 witnesses, 10 family members and 8 accused.
Afgooye (pop. 238,655) an average of 5 cases are heard. 20 people interviewed (5 for each category of court user).
Kismayo (pop. 162,733) an average of 75 cases are heard. 33 people were interviewed, 8 victims, 8 witnesses, 9 family members and 8 accused.
Population figures used are from UNFPA 2014.
Other data sites
In the course of the data collection, it became clear that other districts had functioning justice services (a district court and police station for instance). These districts could not be visited independently and the data verified, so aggregate data were collected from the headquarters of police, courts, custodial corps and office of the Attorney-General. It is intended that full data sets from these locations will be included in the next series of Justice Snapshots. The data sites included in Kismayo: Garbahaarey and Afmadow; and in SWS, Waajid, Buur Hakaba, Baraawe and Marka.
Data collection took place as follows:
- In Jubaland, between 25 February-31 March.
- In SWS, between 24 February-26 March; and
- In Banadir region (Mogadishu), between 25 March-7 April (Court User Surveys were postponed following the closure of courts due to the Corona Virus).
4. Interrogating
The GJG team for South Central remained in Mogadishu during the first part of the Corona virus lock down (24 March-23 April) to interrogate the institutional and survey data.
As the data were cleaned, the GJG team formatted the data sets by institution and entered them in a ‘JSSC Ready’ folder to be sent to each JSSC for their feedback, comment and review. JSSC Ready data were sent in separate packets (ie Police, Darwish, Judiciary, Custodial Corps, Legal Services etc) to each JSSC as follows:
- Jubaland (Kismayo): 2 April
- South West State (Baidoa): 5 April
- Banadir region (Mogadishu): 7 April
In addition, the GJG team cross-checked police training and governance data with the JPP and AMISOM coordination team; the Mobile Court and Community Dispute Resolution Houses / Centres with UNDP; and the Zones of Control (overview map) with UNROLSIG.
Comments on the data from the JSSCs were communicated back to the GJG team through the TS and SPL supervisors and where the changes were substantiated, they were incorporated. Final data sets were then sent back with the changes incorporated.
The data were validated with each JSSC. Due to the pandemic and government guidelines no meetings could be held in person with the JSSC.
Following consultations in each location, the process in Jubaland was agreed whereby the senior member of the JSSC would write to the GJG Team leader validating the data’s provenance and approving the data for publication (with the rest of the JSSC in copy).
In Baidoa, it was agreed that the TS supervisor should write to the GJG to validate the data and approve their publication with those of the JSSC with email in copy.
In Mogadishu, a Zoom call was held with representatives of the Supreme Court, Ministry of Justice and Custodial Corps (the representative of the Mayor of Mogadishu and OAG had technical difficulties) during which the data were validated and approved by each.
A follow up WhatsApp call was made with the representatives of the SC and the OAG (after the Zoom call). The OAG had several comments and these were incorporated and returned. It was agreed that the representative of the SC would write to GJG to validate the data and approve their publication and copy in all the other members of the JSSC.
In addition, all final institutional data sets were sent to the JSSC (Banadir region) which doubles as the Federal level JSSC.
The JSSC validation of institutional data are recorded as follows:
- JSSC (Jubaland) email of Aden Osman Qaloshe, Technical Adviser, Ministry of Justice and Religious Affairs, 28 April 2020
- JSSC (SWS) email of Muna Yusuf, TS Supervisor, 30 April 2020
- JSSC (Banadir region) zoom call with SC, MoJ and Custodial Corps on 22 April, followed by WhatsApp call with SC and OAG on 22 April and confirmed in writing by email of Gulaid Ahmed Hassan, representative of the Chief Justice of Somalia, 1 May 2020.
5. Designing
The design process took place in partnership with Justice Mapping. In order to facilitate the visualization of the data, clear instructions were compiled to assist the developers’ website design and coding. The following steps were taken between 27 April-31 May:
- Crosschecking between the beta version and the survey fields to identify:
- Missing fields
- New fields
- Label changes
- Insertion of icons (i.e. Commentary Icon, Data Note Icon, etc)
- Relationships between values (i.e. total new cases bubble and types of disposition bubbles)
- Create excel file with relational tables between field labels and codes following the coding rules established.
- Create folder for developers to create the website’s backend database including:
- File with final data files for each type of institution (Excel format, labels in 1st row, identify version in document name)
- File with final picture files for each type of institution (jpg format)
- Name of pictures as exported from fulcrum relate the fulcrum IDs of records listed in “photos”, the 2nd sheet within each institution’s data file. This sheet acts as a correspondence table to link pictures with their respective location and caption.
- File with additional information files (Excel format, labels in 1st row, identify version in document name) (I.e. Commentary Table; Monthly Shopping Basket; etc).
Significant changes were required to the Key Measures and Investment Options sections of the Beta Version in light of the data collected and data that could not be collected (ie the Community Perception Survey). The Justice Snapshot Banadir region (Mogadishu) had to be designed from scratch.
The Library was updated. The Commentaries were drafted to assist navigation and deal with any nuances the visualization could not capture.
Fully visualised Justice Snapshots were sent to UNOPS, the JSSCs and heads of institution on 12 June
6. Validating
The continued closure of the international airport in Mogadishu and prevailing conditions in Europe prevented GJG team members from meeting with the JSSCs in their locations to present the Justice Snapshot.
Adapting to circumstances, the GJG team prepared the SPL and TS teams to make the presentations on behalf of the GJG. SPL presented the Justice Snapshot in person to the Federal and Banadir region JSSC in Mogadishu; the TS team (South West State) convened a meeting of the JSSC in Baidoa and the TS Supervisor presented to the JSSC via Zoom link. The TS Supervisor (Jubaland) convened a meeting of the JSSC in Kismayo and presented in person to the JSSC.
These third meetings of the JSSC took place as follows:
- Mogadishu: 24 June
- Baidoa: 25 June
- KIsmayo: 7 July
Notes of comments were taken at the meetings and a separate report of each meeting was supplied by SPL and TS. The comments were incorporated in the Justice Snapshot. All JSSCs approved the Justice Snapshot South Central Somalia 2020 for publication.